
Some cool data from Statcast zones
A preview for some of the stuff I've been looking at

These are the zones around the plate as categorized on the Baseball Savant downloads. They separate the strike zone into 14 slices. Documentation is here: https://baseballsavant.mlb.com/csv-docs
Zones 11-14 are out of the strike zone, most pitches there are balls unless the hitter is too aggressive. Zone 5 is right down the middle. The ump won’t call a ball if you throw it there and the batter doesn’t swing, but he batters do a lot of damage when they do swing.
Anyway, I’ve created a FIP or ERA equivalent based on where the pitch was thrown, with fastballs and non-fastballs in two separate groups. First, the fastballs:
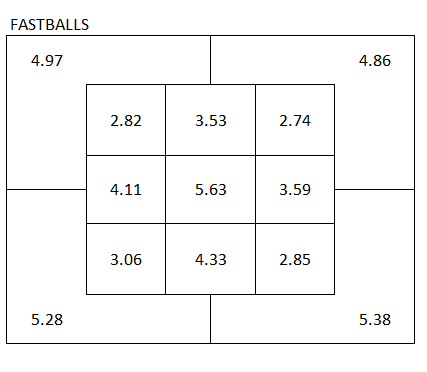
It aligns with what you would expect from intuition. Pitches on the corners are tough to hit. Pitches out of the zone will lead to walks. And pitches down the middle are worse than pitches out of the zone. Throw ball one into zone 14, and you can make up for it by throwing a strike on the next pitch. Throw it in zone 5, and you might need a new baseball.
Here are the non-fastballs:
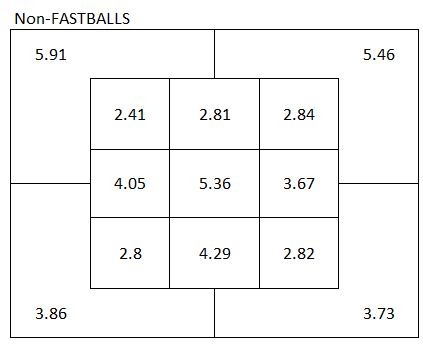
Throwing those outside of the zone and down is often a good option. Definitely depends on the count, but that is where you can get the batter to chase.
I’ll post some more about this stuff soon, still working through some of it. Just thought the visuals looked interesting and wanted to share.
Interesting. The one that surprises me a little is how well hitters do on the low/middle pitches. Would be great to see what these look like by batter handedness, if you're so inclined.
And have to ask (if you happen to know): why is there no zone #10?